


Marysville, Ohio Housing Market Report: September 2026 | Inventory Doubled, Contracts Held
Is the Marysville, Ohio housing market slowing down in September 2026?
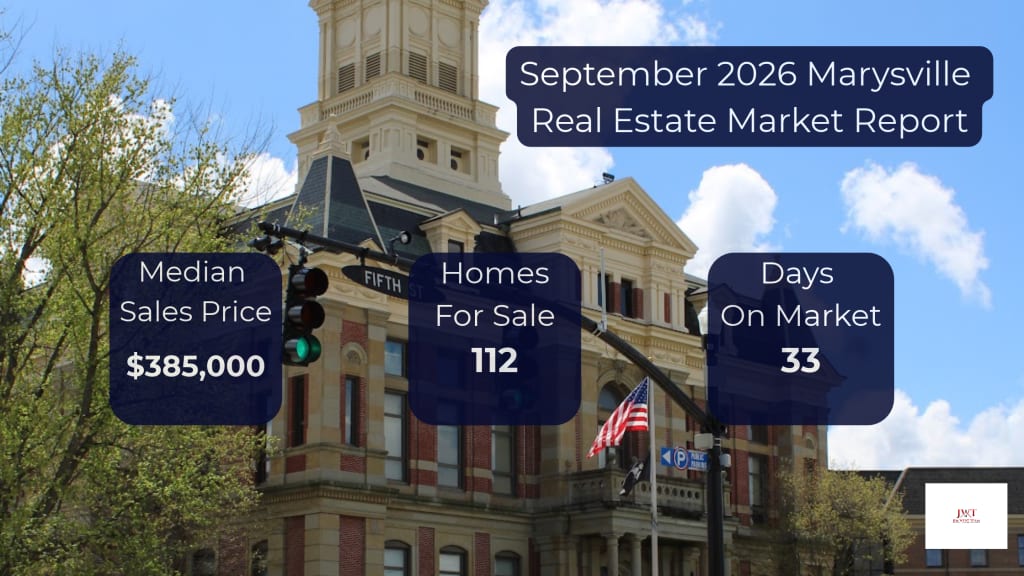
Partly. Homes for sale in the Marysville school district rose 107.4% to 112 and closings fell 27.7%, but contracts held at 40 and the median sale price rose 2.7% to $385,000.
If you looked at the September numbers for Marysville and saw homes for sale more than double, you probably noticed the closed sales number moving the other way. Both are real, and they point in different directions, so it is worth looking at what sits underneath them.
I pulled the full MLS export for the Marysville Exempted Village School District and compared it against the Columbus REALTORS® Local Market Update. One note on method: my export has 37 closed September sales, and the Columbus REALTORS® report counts 34, because three were listed by agents who are not MLS members. With those three removed, my export matches the report to the dollar, and every figure below uses the same 34 sales. (For context, here is the July 2026 Marysville market report.)
The short version: Marysville did not stop selling homes in September. Closings are running behind contracts, supply has kept building since July, and the pricing pattern I showed you in July showed up again.
What this means
- If you are selling: there are twice as many homes competing with yours as a year ago, so the first price matters more. For the second month in a row, homes that never cut price sold in days at full asking, and homes that cut sat for about two months.
- If you are buying: you have more choice than a year ago, and more room to negotiate on homes that have already been sitting.
- For everyone: September had 34 sales. Treat every split in this report as directional, not as a forecast.
The September 2026 numbers for Marysville schools
| Metric | September 2025 | September 2026 | Change |
|---|---|---|---|
| Median sales price | $375,000 | $385,000 | +2.7% |
| Closed sales | 47 | 34 | −27.7% |
| Homes under contract | 39 | 40 | +2.6% |
| Homes for sale | 54 | 112 | +107.4% |
| Months supply of inventory | 1.3 | 2.8 | +115.4% |
| Days on market until sale (average) | 25 | 33 | +32.0% |
| Percent of original list price received | 97.3% | 96.1% | −1.2% |
| New listings | 40 | 58 | +45.0% |
| Average price per square foot | $202.68 | $197.86 | −2.4% |
Why closings fell 27.7% while contracts did not
Closed sales dropped from 47 to 34. Homes going under contract went from 39 to 40. Those two numbers measure different moments in the same process.
A home that closes in September was mostly under contract in August. In September's sales, the median time from contract to closing was 30 days. And August was a slow month for contracts: 45, down 16.7% from the year before. So September's lower closing count is largely the echo of August, while September's own contract count held.
I would not read that as a forecast. It is the thing to watch. If October closings rise to meet September's contracts, the drop in closings was timing. If they do not, that is a different conversation, and I will tell you which one it is in next month's report.
Homes for sale went from 54 to 112. Here is what is in that number.
Inventory more than doubled year over year, and months of supply moved from 1.3 to 2.8. For comparison, the Columbus REALTORS® figure was 2.3 months in July and 2.4 in August, so supply has kept building through the late summer.
In July, I showed you that much of the jump was builder inventory. September looks different. In my October 15 export, I counted the active listings that came on the market by September 30. Of those 129 listings, 101 were existing homes and 28 were new construction, roughly one in five.
The builder homes are asking more and sitting longer. Their median asking price was $529,990, against $414,000 for existing homes, and they had been on the market a median of 114 days against 36 for existing homes. One thing to know when you see builder numbers: eight of those 28 listings are vacant parcels at The Residences at Bethel Woods, where the price shown is an example build-out and the final price is set after the buyer chooses a floor plan. Take those out and the builder median asking price is $491,490. The rest are concentrated in Skybrook and Amrine Meadows. If you are weighing a builder home against an existing one, I wrote a full breakdown on how to decide between a new home and a resale in the Marysville area.
The bigger change is among existing homes. Of the 101 existing homes on the market, 66 (65%) have already reduced their price, at a median reduction of $14,950, or 3.6%. In my July pull it was 49 of 93 (53%). The pull dates differ, so look at the direction, not the decimals: more existing-home sellers started too high.
The pricing split showed up again in September
The Columbus REALTORS® report lists days on market until sale at 33 days. That is an average. The median was 9 days. Sixteen of the 34 homes that sold had 7 or fewer days on market.
Here is the split among September's 34 closings, which looks a lot like July's:
| Never reduced price | Reduced price | |
|---|---|---|
| Number of sales | 21 | 13 |
| Median days on market | 5 | 62 |
| Median % of original list price received | 100.0% | 93.2% |
Fifteen of the 21 homes that never cut price sold at or above their original asking price, and eight sold above it. Only one of the 13 that cut price did. The median seller who reduced received $24,900 less than the original list price and waited about two months longer.
The share of sellers who had to cut also rose: 13 of 34 (38%) in September, against 14 of 50 (28%) in July. Two months of the same pattern tells you it is not a one-month fluke. If you are already in the position of sitting, here is how I think about lowering your asking price in Marysville, and here is how I price a home from the start.
Where homes sold fast, and where they did not
Eight homes closed at $500,000 or more in September, with a median of 2.5 days on market and 100.0% of original list price received. Four of those eight sat on 1.86 to 9.08 acres, and all four sold in five days or less at 100% of original list price or better. Land is carrying the top of this market, the same pattern I pointed out in July.
By price range, the slowest sales were at the bottom:
| Sold price | Sales | Median days on market | Median % of original list |
|---|---|---|---|
| Under $300,000 | 8 | 42 | 92.8% |
| $300,000–$399,999 | 11 | 7 | 98.8% |
| $400,000–$499,999 | 7 | 10 | 99.6% |
| $500,000 and up | 8 | 2.5 | 100.0% |
This sample is small: each range has 7 to 11 sales, so treat it as directional, not definitive. The under-$300,000 group also includes condos and older homes, and five of its eight sellers reduced price.
What the median price does and does not tell you
The September median sales price was $385,000, up 2.7% from $375,000 a year ago. Be careful with that figure for two reasons. First, it is one month of 34 sales. The August median was $367,500, and the year-to-date median is $384,450, down 2.0% from last year. Second, average price per square foot fell 2.4% while the average sales price rose 2.7%, which can only happen if the homes that sold were larger. So a higher median here is partly a different mix of homes, not necessarily higher values for the same home.
That is also why no district-wide number can tell you what your house is worth. Your value depends on your location, condition, lot, features, and the homes that sold near you. If you want your own number, here is how I work out what a house is worth.
One caveat about October
These are September numbers, and my export was pulled on October 15. At least 29 new listings have come on the market since October 1, at a median asking price of $419,900. Only 6 of September's 34 closings were cash, so mortgage rates, which you can follow weekly at Freddie Mac, still shape what buyers can pay. I will have the full October picture next month. For national context, the National Association of REALTORS® research page publishes the monthly housing data.
Frequently asked questions
Is it a good time to sell a home in Marysville, Ohio?
It is a good time to sell if your home is priced correctly. Of September's 34 closings, 21 never cut price and sold in a median of 5 days at 100.0% of original list. The 13 that did cut sat a median of 62 days and received 93.2%. With 112 homes for sale, buyers have more choice, so a first price that is too high costs more than it did a year ago.
Is Marysville a buyer's market right now?
It is more balanced than it was a year ago, but it is not a buyer's market across the board. Months of supply rose from 1.3 to 2.8, and the median sale price is still up 2.7% year over year at $385,000. Existing homes that are priced correctly are still selling quickly. The extra leverage for buyers is concentrated in homes that have already been sitting and in builder inventory.
What is the median home price in Marysville, Ohio?
The median sales price in the Marysville Exempted Village School District was $385,000 in September 2026, up 2.7% from $375,000 in September 2025. The year-to-date median through September is $384,450, down 2.0% from the same period last year. These figures cover all home types.
Thinking about selling in Marysville?
If you want to know what your home would realistically sell for against this specific inventory, I am happy to talk it through, with no pressure and no obligation. Call or text Jim West at (614) 507-5732 or visit jimwestteam.com.
Jim West
REALTOR® | CDRE · RCS-D · CDS
The Jim West Team at Revolution Realty LLC
Marysville, Ohio | (614) 507-5732 | jimwestteam.com
The only real estate agent in Ohio with all three divorce designations.
Data source: Columbus REALTORS® Local Market Update, September 2026, Marysville Exempted Village School District, plus MLS listing data pulled October 15, 2026. Figures reflect residential listing data only and do not account for sale concessions or down payment assistance. Percent changes are calculated by Columbus REALTORS® using rounded figures and can look extreme on small sample sizes.